How We Improved Our Client’s Traffic by 513%
Their Niche & Competitors
Health
WebMD (Domain Rating – 92)
Mayoclinic (Domain Rating – 85)
Problem
The page lacked keyword positioning, an relevant date update, and included non-necessary headings.
Research
? For this project, we analyzed the top 100 search terms driving results for our client within our web-scraper tool & exported all the SERP results out and into our template.
? There were a total of 51,000+ data points measuring 2000+ ranking factors for this analysis.
? After reviewing all the data, we proceeded to develop our on-page SEO strategy to improve our rankings for some very competitive terms. We find this custom-research method works best because each industry, keyword-type, and competitor is very different across verticals.
Solution
? Moved heading up above fold.
? Added keyword variants to headings.
? Updated peer page reviewed by specialist.
? Reduced non-relevant headings not including target terms.
? Added additional content around topics pertaining to target keyword.
GSC Data
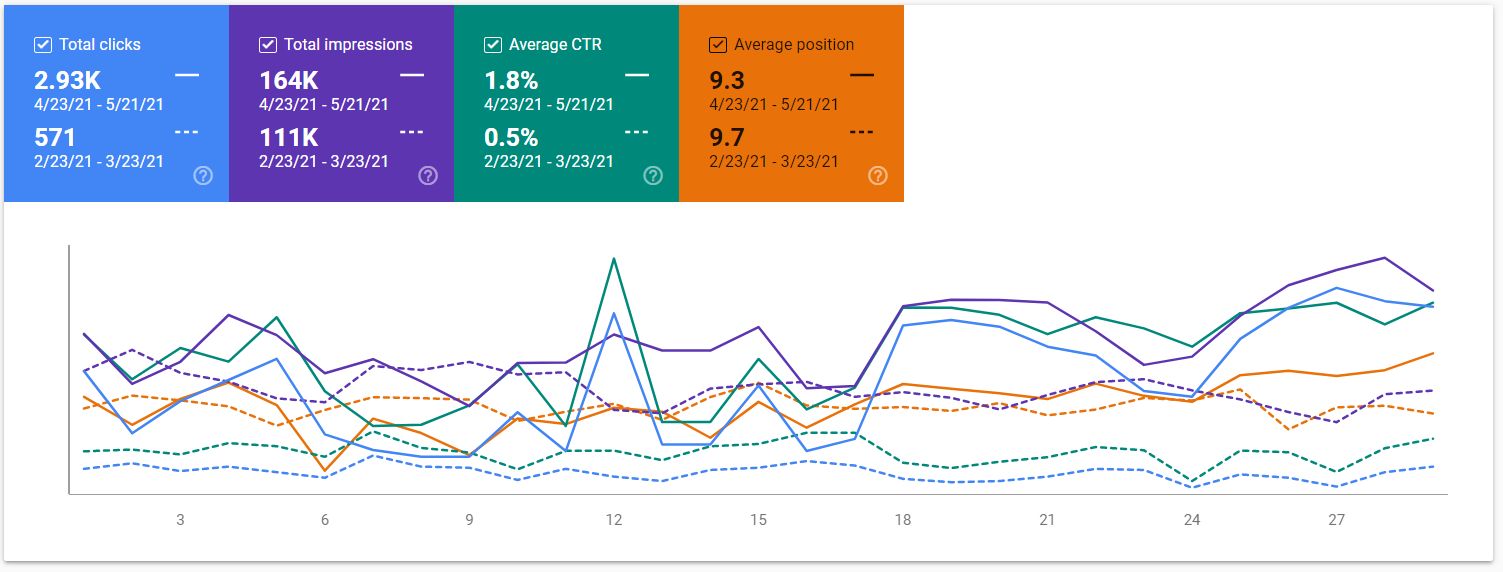
Time Period – 2021-04-23 – 2021-05-21 vs. 2021-02-23 – 2021-03-23
? New Clicks – 2930 (513% Improvement)
? Old Clicks – 571
? New Impressions – 164k
? Old Impressions – 111k
? New CTR – 1.8%
? Old CTR – 0.8%
Want These Results?
They got these results by requesting an evaluation. From there we built a step-by-step plan to increase traffic, boost sales, and grow recurring revenue streams. – Request Your Evaluation.
Below I’m going to breakdown how we achieved these results step-by-step, enjoy!
Long Version – 513% Traffic Improvement
Here’s the framework we’ll be covering today during this case study that mimics our approach towards any successful SEO experience.
1. Identify what keywords are currently driving revenue & leads.
2. Prioritize URLs / keywords.
3. Scrape and collect data to prepare for in-depth correlation analysis.
4. Identify trends and create strategy.
5. Implement.
6. Measure pre/post performance – learn.
Let’s dive right in!
Step 1 – Revenue > Action
Before starting, we always recommend identifying where your revenue is coming from.
You can identify this fairly easily through search term reports in Google Ads or if you aren’t running Google Ads, the next best option is to look closely at the keyword rankings of your top pages filtered by leads/revenue.
As an alternative, Google Search Console works well or if you can’t find enough data within GSC, Ahrefs will do just fine.
The example we’re using below is also in the health space and compares January 21′ with December 20′ data. There is no seasonality with this product.
For this particular sample below, we saw a 27.65% improvement in traffic and 27.20% improvement in revenue after our first round of page changes & figured this would be a good candidate to describe our initial process in SEO.
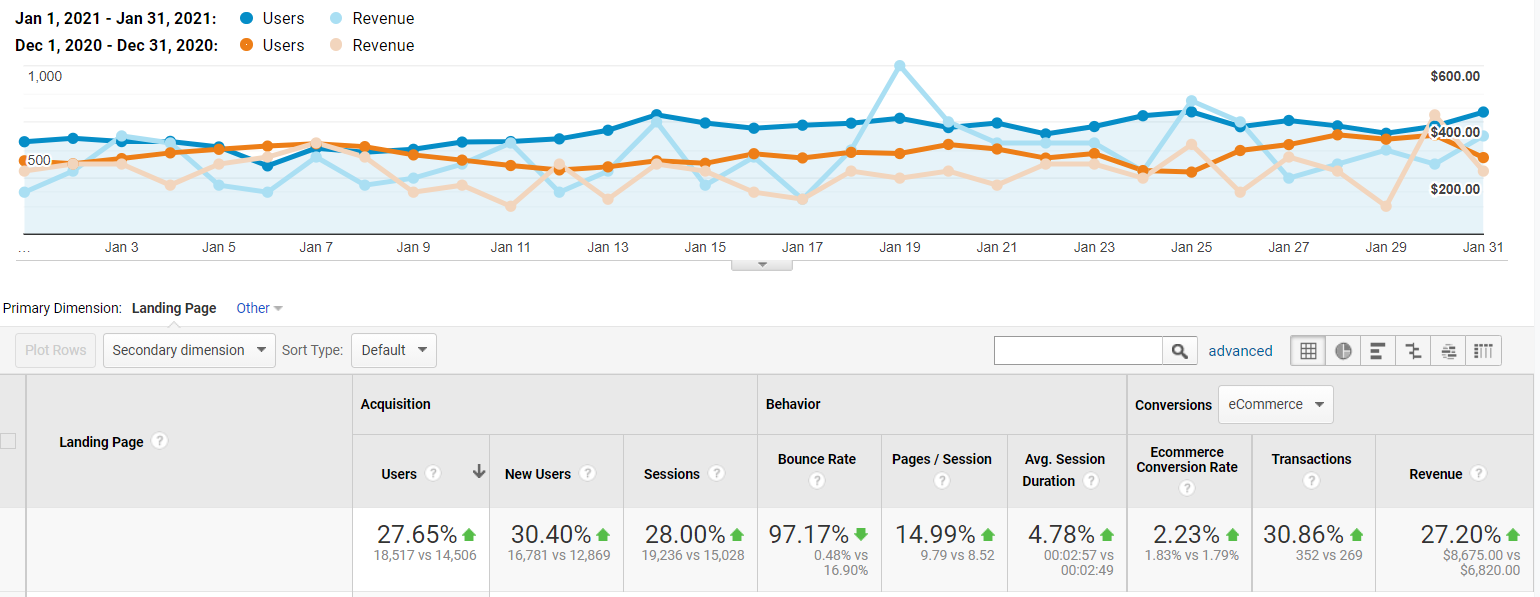
Looking over our top pages, this seemed like a good target based on the total traffic & current revenue because our entire site does about $100k – $110k organically per month in revenue & this singular page – makes up 8% of that.
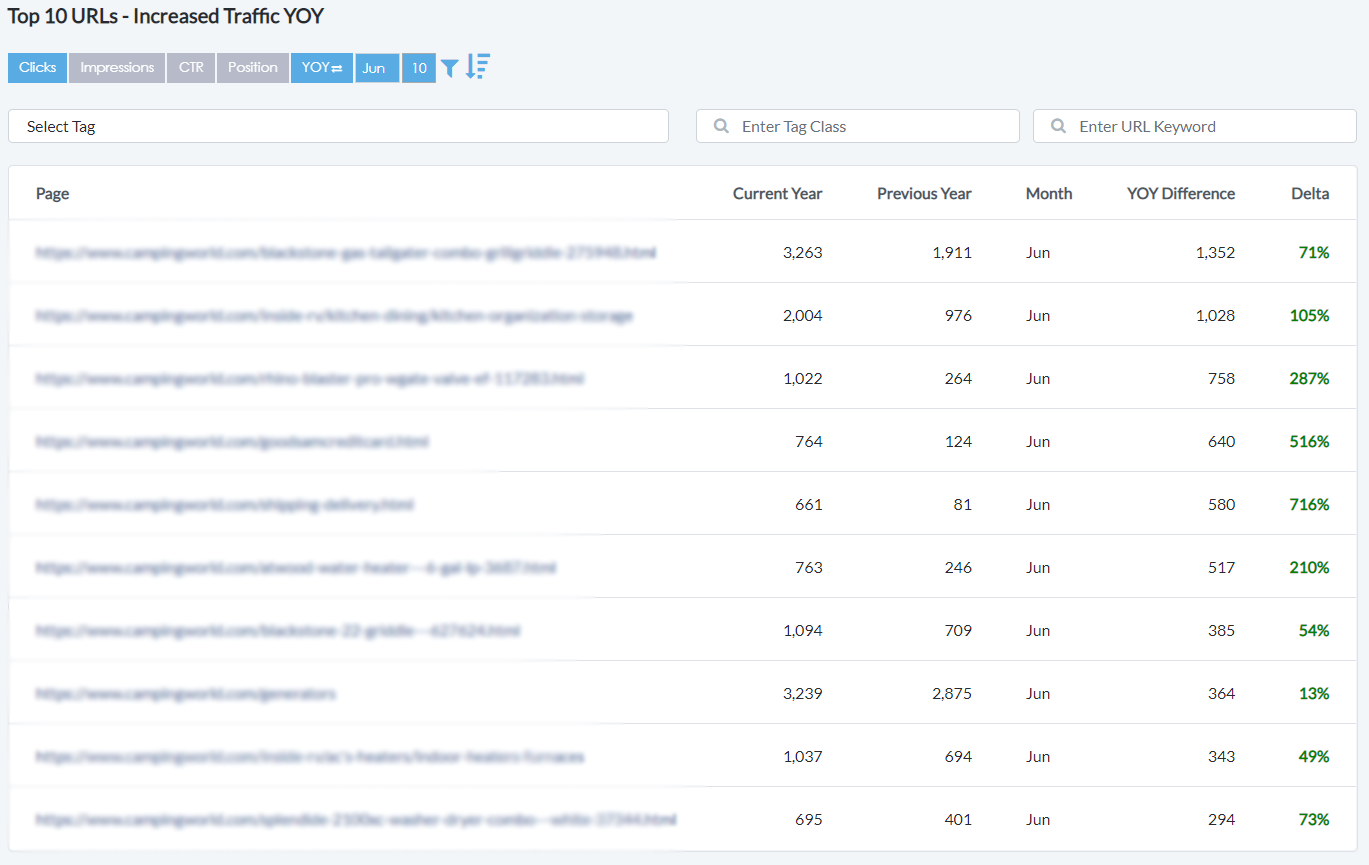
Now for identifying the target keywords driving revenue. See GSC screenshot of this page below:
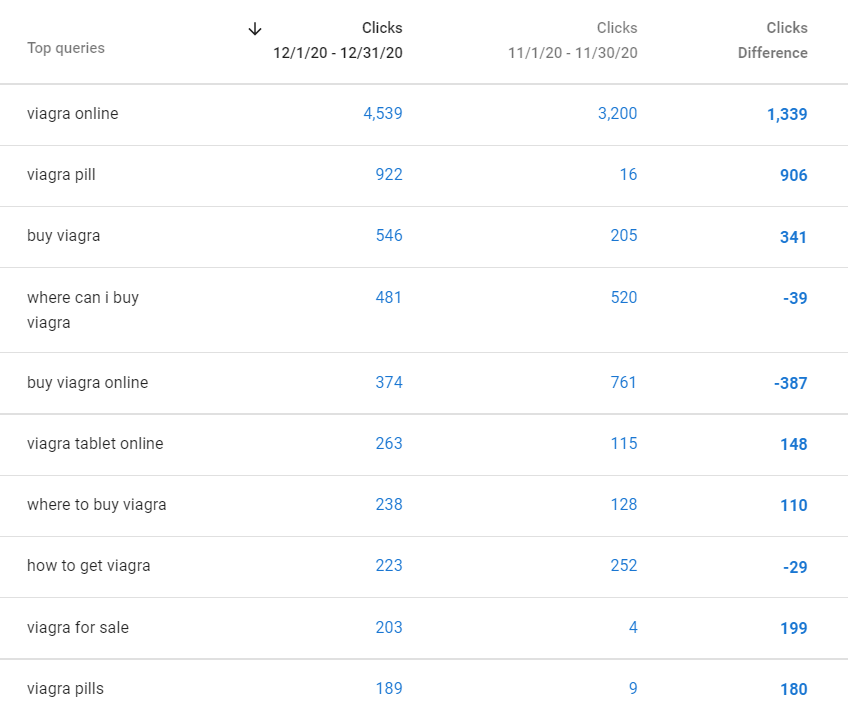
The trick here is to find two months with a 15% or greater swing in a positive or negative direction – then compare the two date periods within Google Search Console.
Through deduction, we can determine that our 27.20% increase in revenue did not likely come from “buy viagra online” because we saw a -387 or 51% decrease in traffic to this specific search term.
That leaves our probability of “buy viagra” and “viagra online” and “viagra pills/pill” or “viagra for sale” likely to be our true revenue drivers.
However, this impression goes against conventional wisdom. This could also mean that these keywords are of equal conversion-driving opportunity because terms that contain “buy” or “online” have higher purchasing intent & we don’t want to count these out.
This is the gray area in the keyword research / selection process. It’s important to keep a conscious mind & ask plenty of questions while performing research to ensure these insights are not missed.
Once you’ve identified what terms or types of terms are the true revenue drivers, it’s time to prioritize your keywords and URLs.
Step 2 – Prioritize URLs and Keywords
For your prioritization process, we recommend building out a projection report for each page to observe the true potential of ranking #1 for the desired search terms driving revenue & what that looks like traffic-wise if you were to bid for these terms in Google Ads.
The calculation is simple, you’re going to identify what the average CTR from search result is for each keyword average position.
For example, if you’re ranking #1 for “viagra online” & your CTR is 33% – and you’re ranking #6 for “viagra pill” with a CTR of 6%, we can then calculate the potential of “viagra pill” when we reach a #1 position.
The math goes something like this [projection keyword volume]x[projection position CTR] – [current keyword volume]x[current position CTR].
So if we’re taking the term “viagra online” Ahrefs states this term is searched 38,000 times per month.
Multiply the volume by CTR – 38,000 x 0.33% = 12,5340 (minus) 38,000 x 0.06% = 2,280
Subtract the totals – 12,540 (minus) 2,280
Total possible incremental traffic – 10,260
You could even take this a few steps further as we demonstrate below.
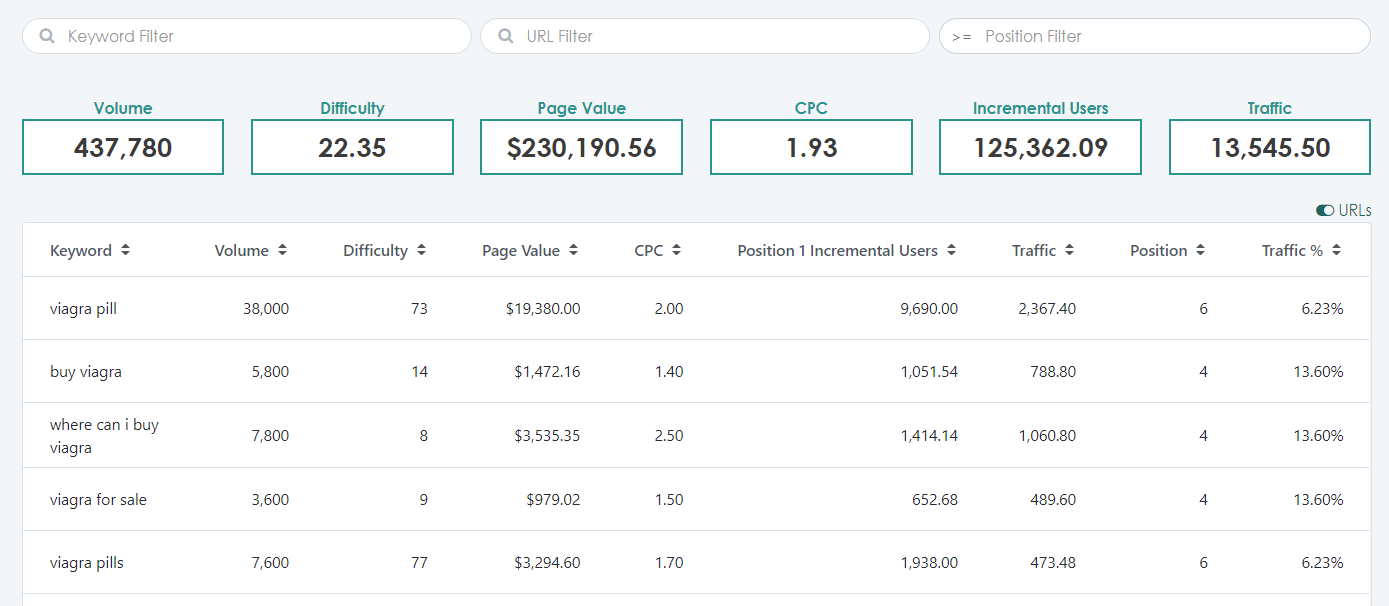
We like to use our internal software for this to speed up the process (screenshotted below):
Our difficulty score is a combination of factors.
We check the number of results for:
1. intitle:”keyword”
2. inurl:”keyword”
3. Backlinks
4. Quality of backlinks
5. Backlink type
6. Etc.
This helps give us an ideal scale for how difficult it may be to improve rank for our target keywords.
Another incredible data point to consider during this phase is CPC. When a keyword has a higher-than-average CPC value compared with similar terms to the page, we can safely presume that this keyword is driving revenue & conversions for those bidding in Google Ads.
As a result, these terms make great keyword targets to rank for organically.
CPC also helps us determine a page’s current and potential worth, I’ll explain below.
To calculate potential value, take the CPC values and multiply them by potential traffic.
In this case, when we ranked #1 for “viagra pill” this page improved by $19,380 in worth each month and we don’t need to pay for this traffic in Google Ads since it’s organic traffic. An incredible win.
Additionally, if your Google Ads average 2x ROAS, then we can project that ranking #1 for this term will drive an additional $40k in revenue each month for our client.
Once you complete your analyses, it should be obvious which pages to target first prioritized by revenue-potential. Think of this as an 80/20 exercise. We’ve found in some occurrences, 75% or more of a websites revenue is going to be generated through a small set of pages and that’s where you should focus your efforts.
Step 3 – Scrape and Collect Data for Correlation Analysis
This next step is fairly data-heavy but the insights are flawless.
I like to approach SEO without an opinion. When we take this perspective and stance, we avoid common issues with assuming certain tactics will work and others will not work. There’s no maze in data, it either is or it isn’t.
Avoid being stuck in the maze.
All the data we need to do SEO is right there waiting for us on the first and few pages after a Google search. When this data is combined with search intent + audience insights, we have a match made in heaven.
Let me explain.
Depending on the page-type you’re wanting to rank (article, PDP, PLP, review, news article, blog), Google values the structure, contents, technical aspect, and authority very differently. This also varies by industry.
For example – “camping tents” and “how to lake fish” are going to be showing radically different pages in the search results. It’s highly unlikely that a PLP will show up on the search results for a “how-to” based query.
This concepts purpose is to provide users with the best possible search result & is a critical part of Google’s algorithm. In addition to this information, Google tends to rank pages that it “likes” on page 1, and doesn’t “like” as much on page 2 & beyond. So how do we use this information to our advantage?
We create a correlation analysis.
Now doing this manually isn’t ideal, and very time consuming. So how do we scrape this data and automate this process?
We used our web scraper to gather all this info from search results pages 1-5 for our target keywords (about 50 URLs per keyword) but there are alternatives out there like SurferSEO.
Once you’ve gathered all your data, it’s time to write your excel functions.
If you’d like the excel template for this, feel free to reach out to us here and we’ll show you how it works – contact us.
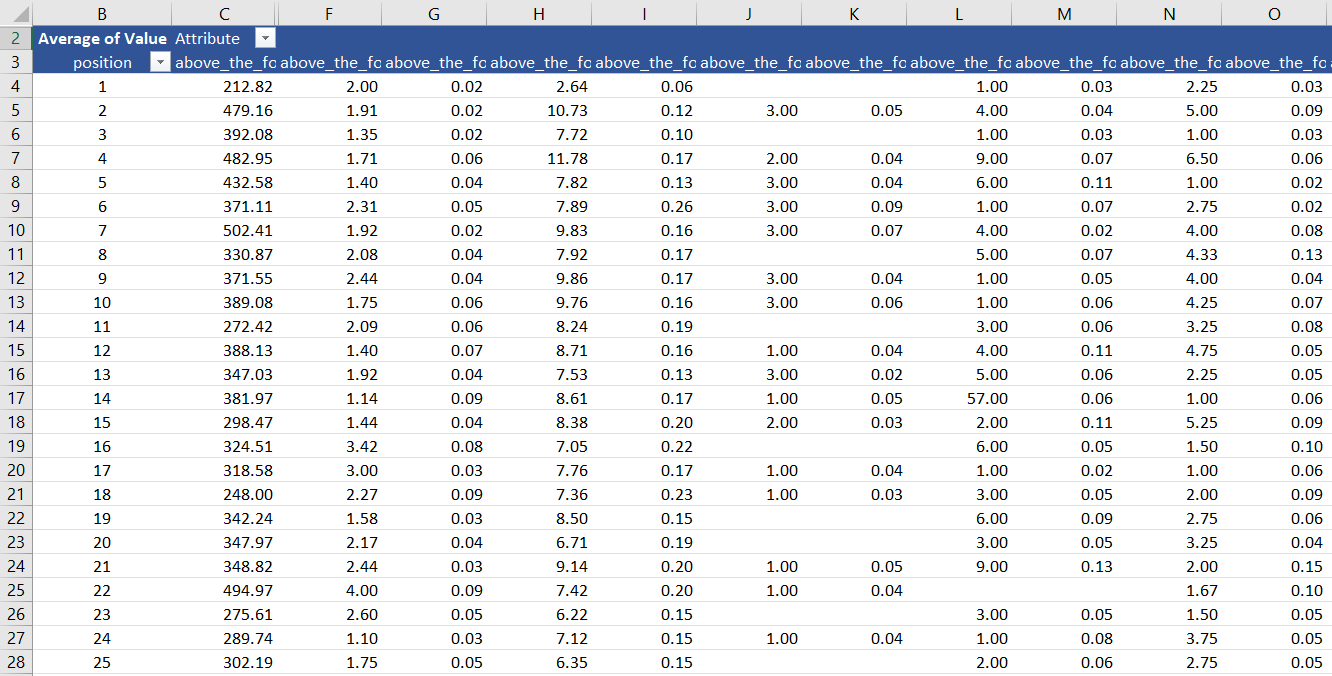
After the table data is complete, average the results across positions 1-10, 11-20, 21-30, etc.
Once you have these average results across each variable you’ll be measuring, it’s time to compare the differences & notate anything out of the ordinary that can be used within your SEO strategy to improve the odds of ranking on page 1.
Invest the time here & avoid many headaches later.
Step 4 – Identify Trends and Create Strategy
Remember those “Spot the Difference” books we all had as kids? Well, that’s what you’re going to be doing here. Let’s cut through the fluff & get strictly the information we need.
Questions like:
1. Do the webpages on page 1 all have the target keyword in the meta title, meta description, and URL while the webpages on page 2 don’t? Note that down.
2. Are all the webpages on page 1 using the target keyword within the heading tags while the web pages on page 2 don’t? Note that down.
3. Do all the webpages on page 1 have 2000+ words while webpages on page 2 have under 1000? Note that down.
At the end, you’ll be left with a list of something like this below:
? 200+ characters above the fold or 35-60 words.
? Include keyword 1-2 times above the fold, never more. About 1-2% density.
? Lower partial keywords above the fold, don’t over use.
? The more common words included within the body text, the higher the rankings.
? Page 2 on average is missing 187 common words compared to page 1 at 139.
? Page 1 uses 125 partial keywords versus page 2 using 118.
? Page 1 averaged 1623 words versus page 2 at 1496.
? H1 character count is at 32 for page 1 versus 38 for page 2.
? H1 element count is at 1.08 versus 1.31 for page 2.
? Every page in page 1 and page 2 used the target keyword in H1.
? Page 1 uses partial keywords 2.56 in H1’s while page 2 is 2.61.
? Page 1 uses 5.33 words in H1 versus 5.98 on page 2.
? Page 1 uses 7.02 H2’s on average compared to page 2 using 6.6.
? Page 1 uses target keywords in H2s on average 1.78 times versus page 2 at 2.43.
? Page 1 uses partial keywords 6.08 times in h2’s while page 2 uses them 6.98.
? Page 1 uses H2’s word counts around 20 total versus page 2 at 23.16.
? Page 1 uses H3’s on average 9.49 times versus page 2 at 6.53.
? Page 1 uses keywords within H3s 2.51 times versus page 2 at 2.05. One result here was at 9.67 which drastically skews the results.
? Page 1 uses partial keywords 7.53 times on average in h3’s versus page 2 at 8.89.
? No statistical relevance between H3 word counts.
? Page 1 h4 element count averaged 2.79 versus page 2 at 4.63.
? Page 1 averaged 3.90 images while page 2 averaged 4.33.
? Page 1 image alt text averaged 32.78 while page 2 averaged 39.75.
? Page 1 unique external links averaged 32.62 while page 2 averaged 21.60.
? Page 1 internal links averaged 84.56 versus page 2 at 88.77.
? Page 1 meta description characters averaged 168.78 versus page 2 at 209.03.
? Page 1 meta description exact keyword averaged 1.20 versus page 2 at 1.16.
? Page 1 meta description partial keywords averaged 4.62 versus page 2 at 4.84.
? Page 1 averaged 9.28 target keywords versus page 2 at 7.37.
? Page 1 partial keyword use averaged 85.63 versus page 2 at 79.70.
? Page 1 paragraph word count averaged 1085.67 versus page 2 at 1053.
? Page 1 sitespeed HTML size averaged 187225.10 while page 2 averaged 153734.89.
? Page 1 load speed averaged 2831.95 versus page 2 at 3210.56.
? Page 1 total size averaged 585.09 versus page 2 at 1654.42.
Now that you have your blueprint to page 1, it’s time to start taking massive action.
Step 5 – Implement
We recommend implementing changes to webpages in batches of 5-10 – launched live on the same day.
This will make it much easier for you later to analyze the pre and post results of each webpage change.
Step 6 – Measure Pre/Post Results – Learn
This is where the fun begins.
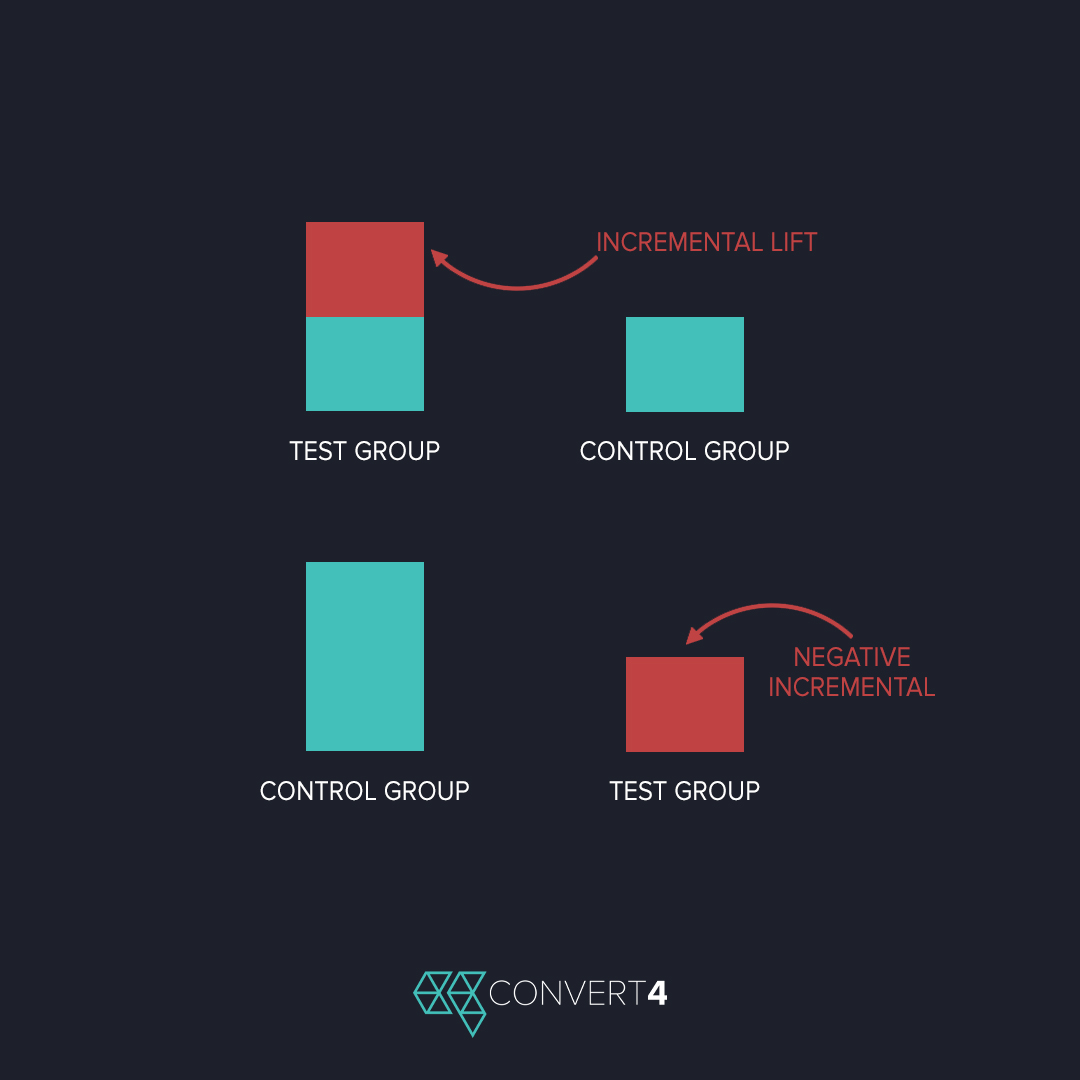
Take 4, 8, and 12 week benchmarks for each website page from Google Analytics and Google Search Console. This information is going to be your north-star in identifying which tactics worked and which tactics did not work. If you’d like to take this a step-above, identify pages for a control group & compare results between your testing pages & control group pages.
This technique creates a clear incremental lift (positive result) or negative incremental (negative result) to your website page tactics.
From there, it’s easy to sharpen up your skills & tactics moving forward.
With negative SEO algorithms and Google’s random algorithms, you’re looking for general upward trajectory & not an immediate improvement across every website page change. Webpages rarely ever all increase after on-page changes because Google needs to retest the page & evaluate how the new traffic coming from your target keywords are behaving on-page.
A simple website change log & review the pages manually in GSC and Google Analytics will do but we like to use our internal software to automate this process and improve our learning efficiency. (screenshot below)
Want results like these? Reach out to us here – contact us.
As always – keep testing, keep improving, and we’ll see you on the SERPS!
P.S. don’t forget the big 3!
1. User Experience
2. TTFB/Page Speed
3. Technical SEO