How We Created a Blog That Generates 700+ Backlinks Per Year
We all know creating content relevant to our services/products improves top-of-funnel traffic & bolsters our relevancy towards these keywords with Google but how do we create a structure & machine that generates more backlinks naturally?
For the majority of our clients, we’re running outreach campaigns reaching out to journalists & bloggers securing high domain rating backlinks regularly.
Most of the time – this tactic works well enough on it’s own to improve rankings and drive results.
However, there are occurrences where competitor SEO budgets are reaching 5-digits and 6-digits monthly which makes things a bit more complicated to reach position #1.
So, in order to compete at this highest level, we sought out to create a backlink generating machine for our clients to improve the number of “passive” backlinks our blog pages were getting on a recurring basis.
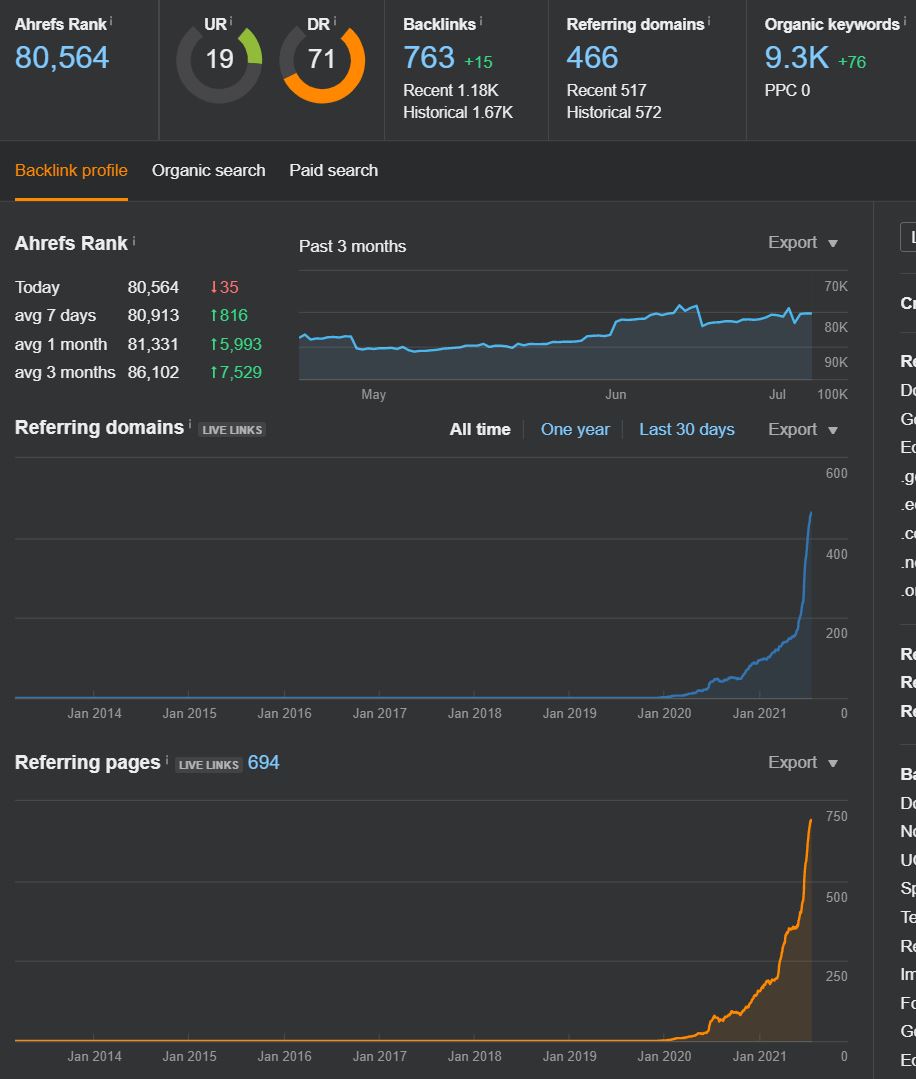
Our goal was to achieve results like this, with every project (Ahrefs backlink report):
And like this (Google Search Console impression growth):
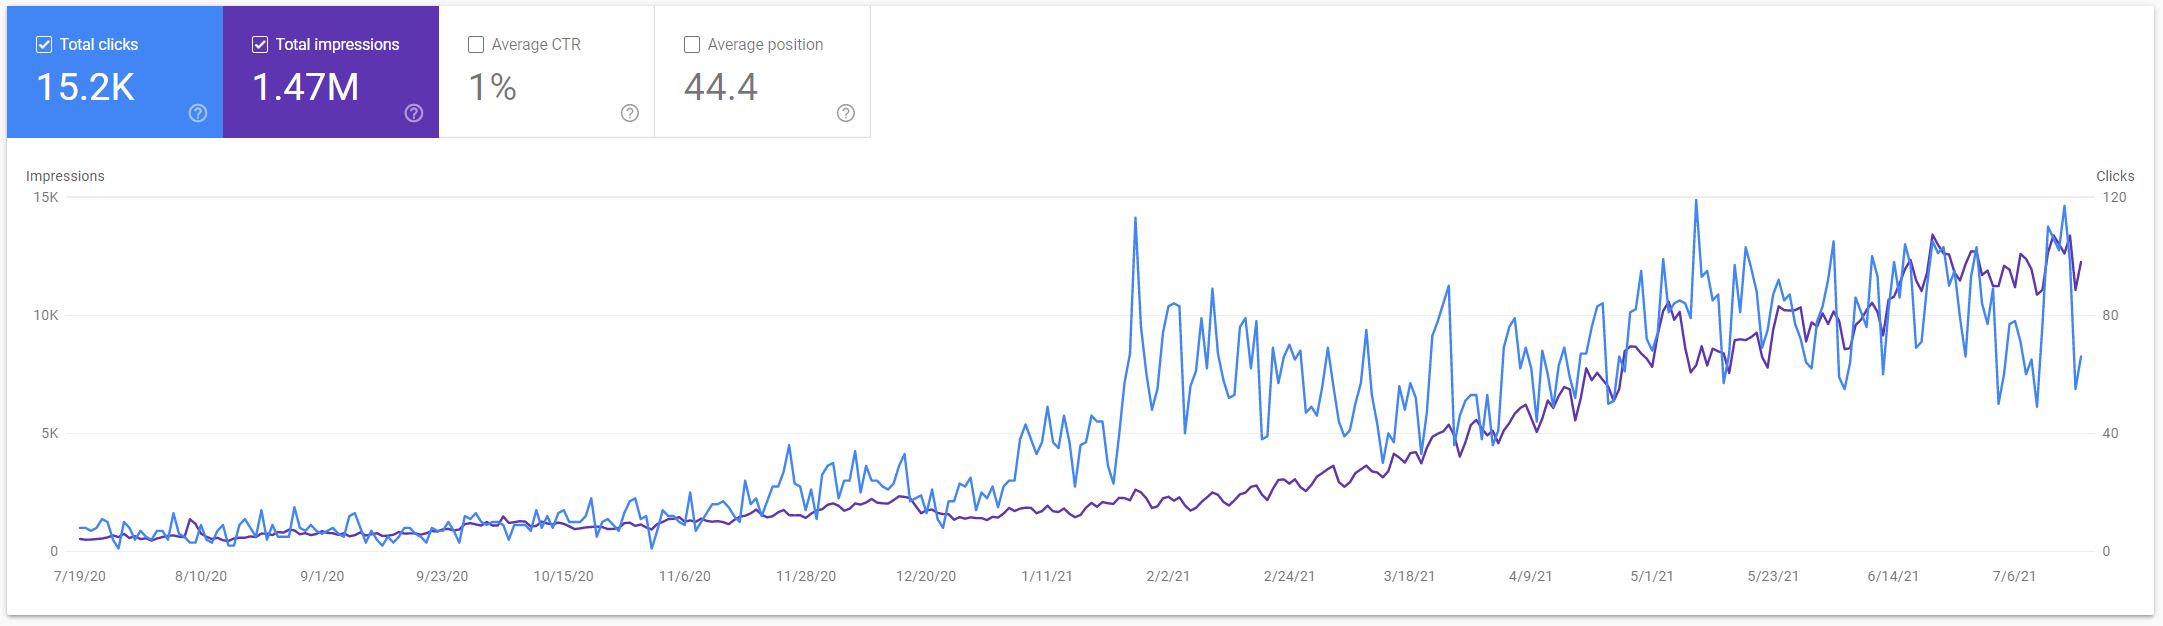
In this occurrence, our impression growth grew from practically nothing to almost 1.5M users seeing our listings on Google in less than 1 year for some competitive terms.
Here’s the breakdown of how this works:
1. Blog page structure and layout.
2. Blog article structure.
3. Blog article optimization.
4. Blog article promotion.
Step 1 – Blog Page Structure and Layout
Below is a sample structure of a blog homepage layout for a recent client undertaking this project with our team.
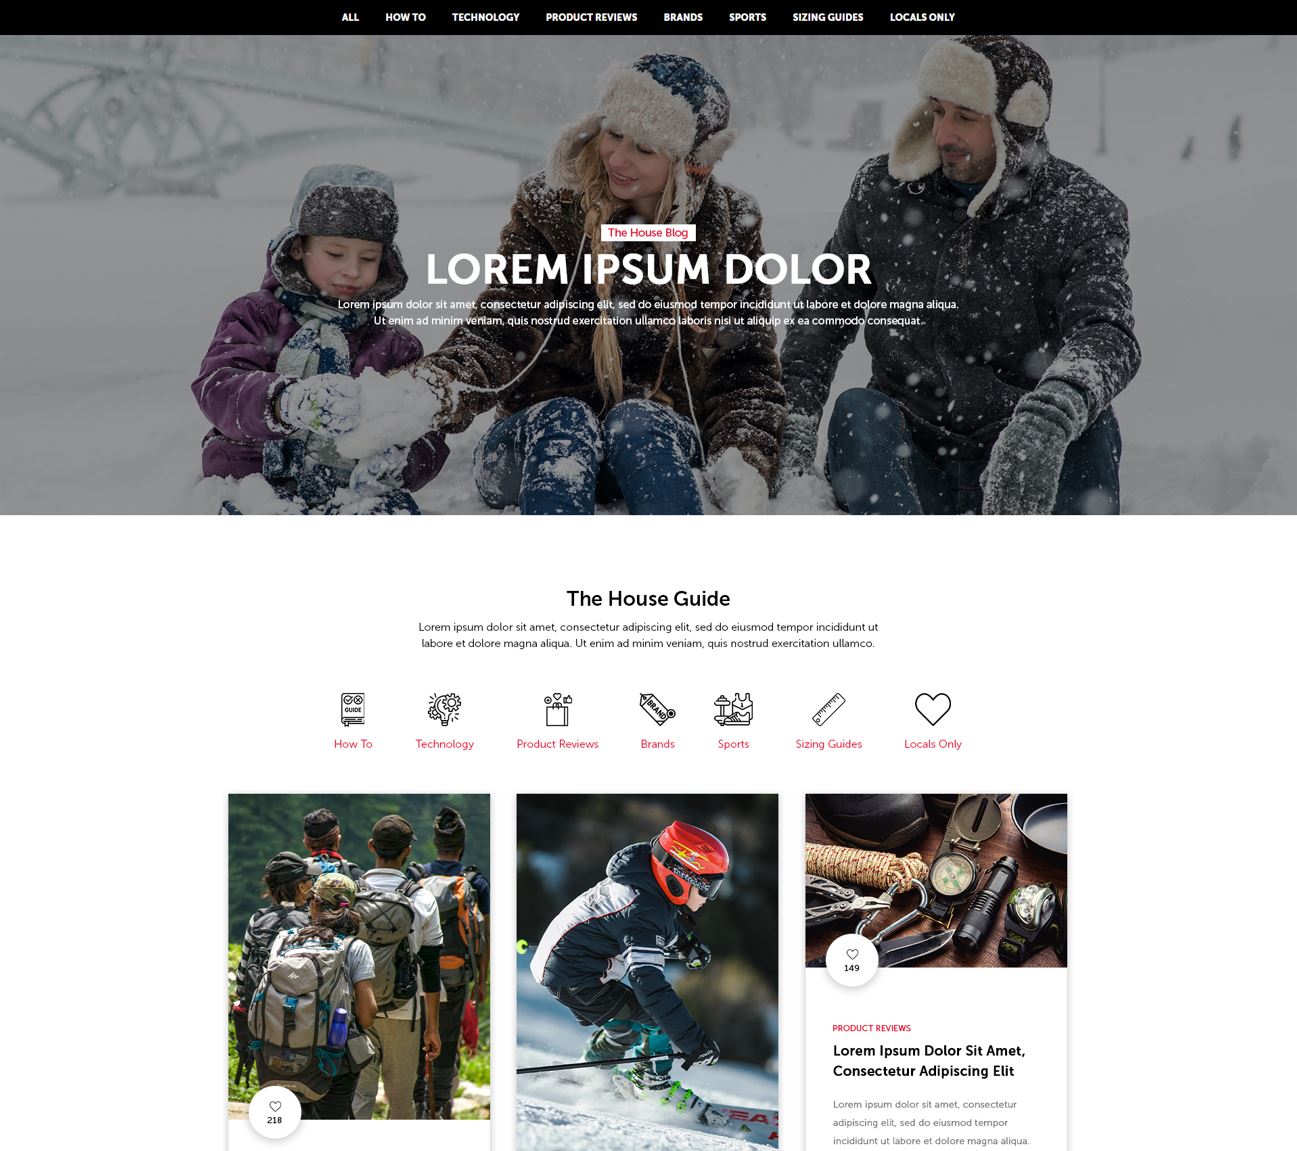
The most important elements to note here are the category selections of:
1. How To
2. Technology
3. Product Reviews
4. Brands
5. Sports
6. Sizing Guides
7. Locals Only
The goal here is to neatly categorize and tag all posts to create an easy navigation / filtering / sorting experience for potential visitors. (Google too).
It turns out, users and Google’s current algorithms favor this structure due to the ease of accessing information.
For this project, we’re currently working with over 3,000 blog posts to clean-up, filter, categorize, restructure and are anticipating some incredible gains.
To finish step one of this process, make a list of all your categories / types of topics covered within your blog.
Consolidate as much as possible. If it’s confusing for you, it’ll definitely be confusing to the user.
Step 2 – Blog Article Structure
One of the most important ranking factors right now is how quickly and how efficiently you’re delivering information to your prospective organic visitors.
People have zero patience & need to find what they’re looking for FAST otherwise they’ll be smashing that back button and going to a competitor.
With that in mind, here is the blog article format we’re seeing working the best to improve readability, increase average session duration, and reduce bounce rate.
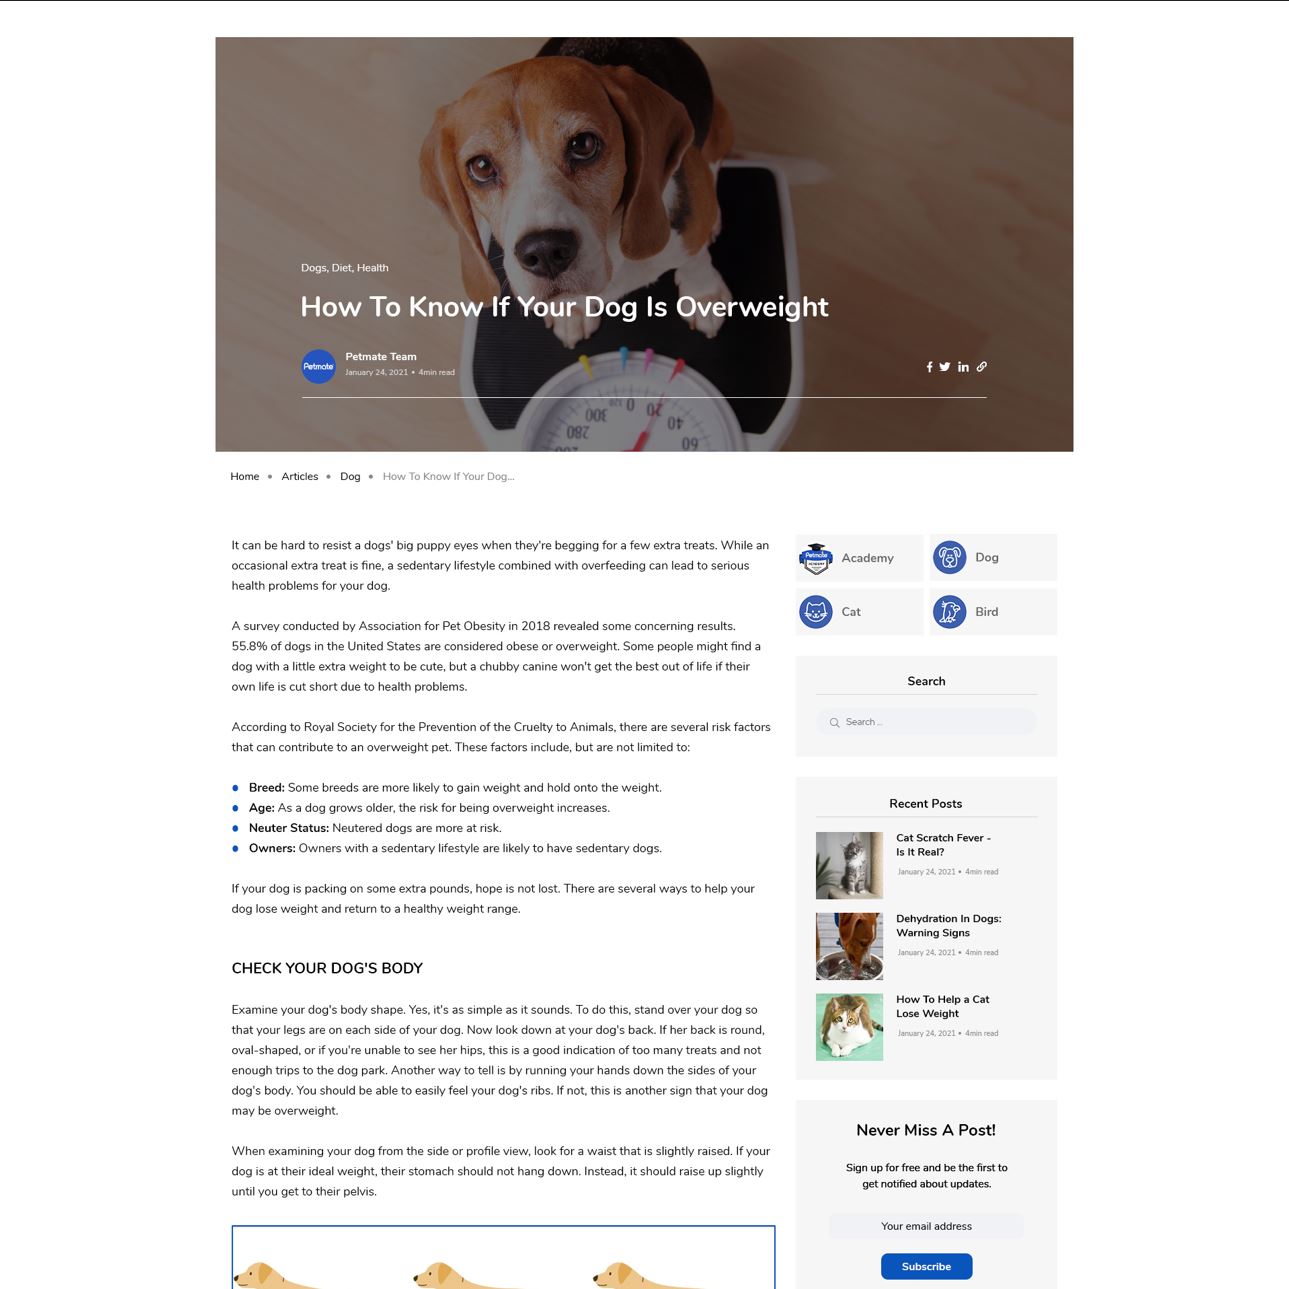
Some important elements to keep in mind here:
? Use statistics above the fold (this is where journalists are reading first to find sources).
? Utilize the sidebar for recent or related posts.
? Always include a search feature for someone to find what they’re looking for quickly. Remember, we need to make it SUPER easy to access the information searchers are looking for.
? Always include related or popular posts at the bottom of the article. Give your user somewhere to go NEXT before hitting the back button and hurting your bounce rate.
? Include an author bio or link to an author bio page where you list out all related credentials this author has to justify expert opinion. This is HUGE in the BERT algorithm. E.A.T. = Expertise, Authority, Trust.
Step 3 – Blog Article Optimization Checklist
While creating content for our clients, our articles regularly top the charts in performance for traffic YoY and here’s why – we run a massive correlation analysis of their top 100 search terms and identify the 100’s of things competitors are doing right or wrong prior to creating our writing guidelines.
This differs from industry type and there’s no 1-size fits all, but here’s a general idea of what the learnings look like once we finish this correlation analysis:
? 200+ characters above the fold or 35-60 words.
? Include keyword 1-2 times above the fold, never more. About 1-2% density.
? Lower partial keywords above the fold, don’t over use.
? The more common words included within the body text, the higher the rankings.
? Page 2 on average is missing 187 common words compared to page 1 at 139.
? Page 1 uses 125 partial keywords versus page 2 using 118.
? Page 1 averaged 1623 words versus page 2 at 1496.
? H1 character count is at 32 for page 1 versus 38 for page 2.
? H1 element count is at 1.08 versus 1.31 for page 2.
? Every page in page 1 and page 2 used the target keyword in H1.
? Page 1 uses partial keywords 2.56 in H1’s while page 2 is 2.61.
? Page 1 uses 5.33 words in H1 versus 5.98 on page 2.
? Page 1 uses 7.02 H2’s on average compared to page 2 using 6.6.
? Page 1 uses target keywords in H2s on average 1.78 times versus page 2 at 2.43.
? Page 1 uses partial keywords 6.08 times in h2’s while page 2 uses them 6.98.
? Page 1 uses H2’s word counts around 20 total versus page 2 at 23.16.
? Page 1 uses H3’s on average 9.49 times versus page 2 at 6.53.
? Page 1 uses keywords within H3s 2.51 times versus page 2 at 2.05. One result here was at 9.67 which drastically skews the results.
? Page 1 uses partial keywords 7.53 times on average in h3’s versus page 2 at 8.89.
? No statistical relevance between H3 word counts.
? Page 1 h4 element count averaged 2.79 versus page 2 at 4.63.
? Page 1 averaged 3.90 images while page 2 averaged 4.33.
? Page 1 image alt text averaged 32.78 while page 2 averaged 39.75.
? Page 1 unique external links averaged 32.62 while page 2 averaged 21.60.
? Page 1 internal links averaged 84.56 versus page 2 at 88.77.
? Page 1 meta description characters averaged 168.78 versus page 2 at 209.03.
? Page 1 meta description exact keyword averaged 1.20 versus page 2 at 1.16.
? Page 1 meta description partial keywords averaged 4.62 versus page 2 at 4.84.
? Page 1 averaged 9.28 target keywords versus page 2 at 7.37.
? Page 1 partial keyword use averaged 85.63 versus page 2 at 79.70.
? Page 1 paragraph word count averaged 1085.67 versus page 2 at 1053.
? Page 1 sitespeed HTML size averaged 187225.10 while page 2 averaged 153734.89.
? Page 1 load speed averaged 2831.95 versus page 2 at 3210.56.
? Page 1 total size averaged 585.09 versus page 2 at 1654.42.
With this checklist, we craft the perfect blog, every time. It’s an evolving process – we typically run a new analysis every few months to ensure nothing major has changed (which is usually does, thanks Google.)
Step 4 – Blog Article Promotion
The last and final step before measuring pre and post performance is promotion.
In this promotion phase, we’re going to be focusing on two things:
1. What data and research do we have that journalists would find helpful in news stories?
2. What journalists or publications would want this information?
In most cases, our reporter articles are either opinion pieces, quotes or data mentions. See examples below:
? DR 82 – https://www.reliablecounter.com/blog/how-to-make-money-using-a-platform-like-bitcoin-profit/
? DR 77 – https://www.noupe.com/business-online/freelance/how-to-market-yourself-as-a-freelance-software-developer.html
? DR 68 – https://devskiller.com/programmer-vs-developer/
So, how do we need to approach our PR pitches? With data backed opinions & juicy quotes.
We find that with this tactical approach, we touch base on 90% of what the journalist is looking for to include as a nice corner piece within their article.
Step 5 – Start Your Project
Need help restructuring your blog from homepage to article page & running promotion strategies to hit 700+ passive backlinks per year? ? Reach out to us here to receive a free evaluation. ?